

What is OEE?
Overall equipment effectiveness (OEE) is a single percentage that tells you how much of your planned production time is actually producing good parts at the rate the equipment was designed for. A machine at 100% OEE runs every scheduled minute, at full speed, with zero defects. Nobody is at 100%.
The point of OEE is not the number itself. It is that the number breaks down into three causes, availability, performance and quality, so you can see where the lost capacity went instead of arguing about it. A line that 'feels busy' can easily be delivering half of what it could, and OEE makes that visible in a way that daily output counts don't.
OEE is usually measured per machine or per line, per shift, and reviewed as a trend rather than as a one-off score.
How is OEE calculated?
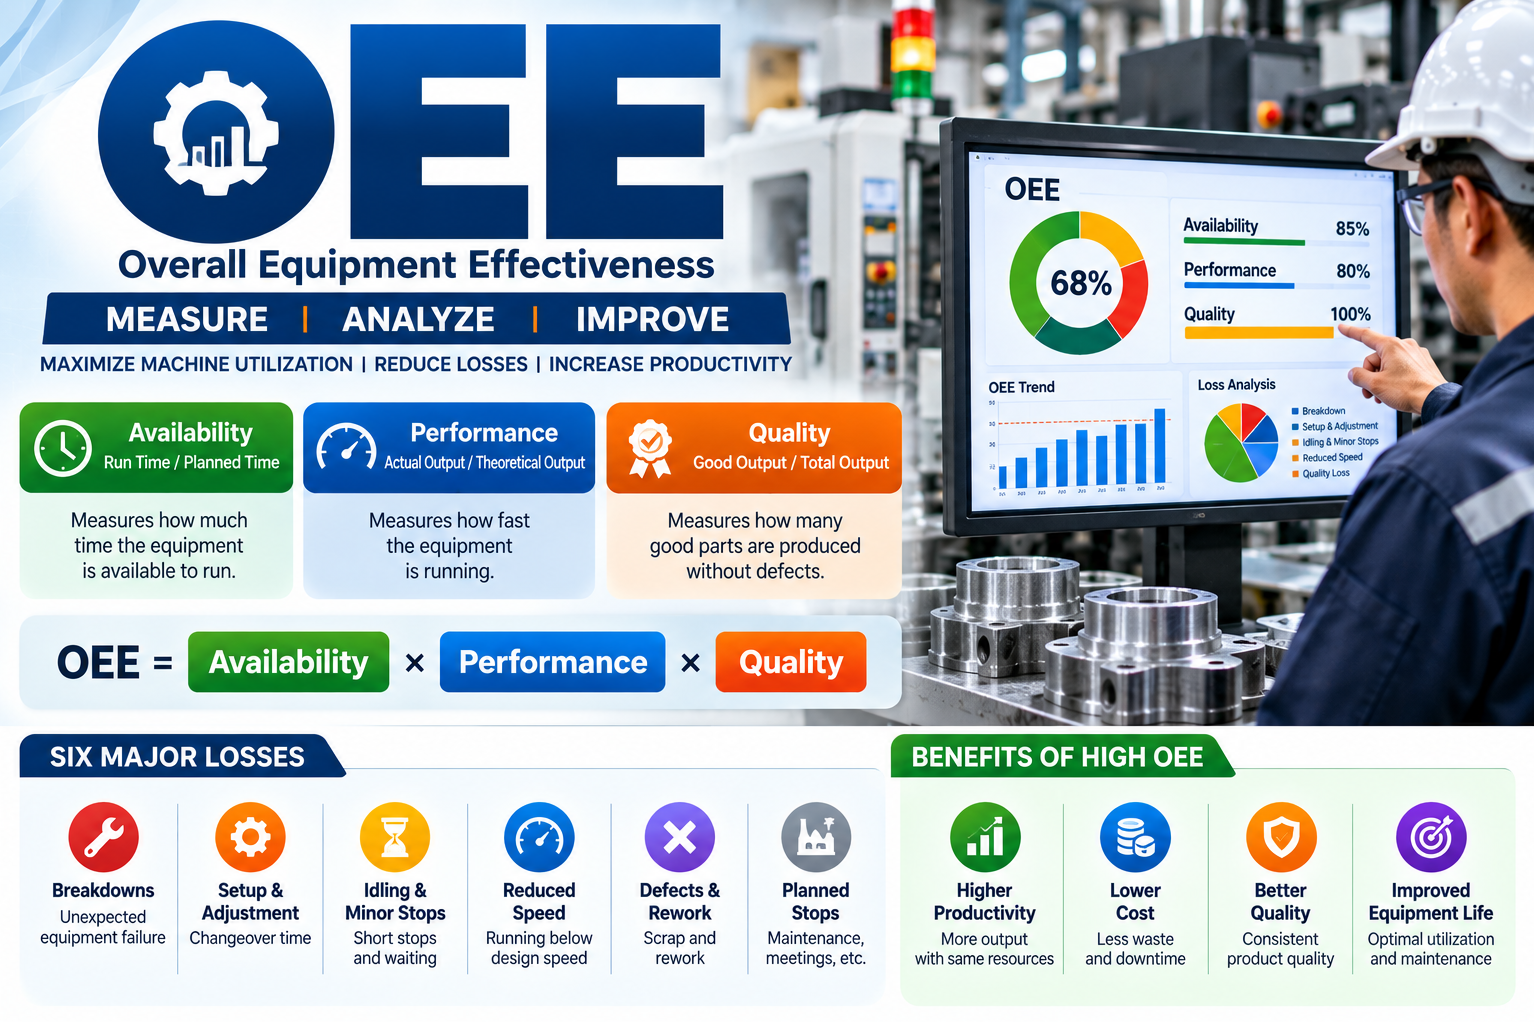
OEE is the product of three factors, each a percentage:
OEE = Availability X Performance X Quality
- Availability = run time ÷ planned production time. It captures every stop, planned or not: breakdowns, changeovers, waiting for material. Breaks and planned non-production time are excluded from planned production time.
- Performance = (ideal cycle time × total parts made) ÷ run time. It captures everything that makes the machine run slower than its design speed: minor stops, jams, reduced speed.
- Quality = good parts ÷ total parts made. Scrap and rework both count against it. A part that had to be reworked is not a good part on the first pass.
A worked example (illustrative numbers, not a real plant): one 8-hour shift, 480 minutes planned. Breakdowns and changeovers cost 60 minutes, so run time is 420 minutes and availability is 87.5%. The machine's ideal cycle time is 30 seconds, so it should have made 840 parts in 420 minutes; it made 720, so performance is 85.7%. Of those 720, 36 were scrapped, leaving 684 good parts: quality is 95%.
OEE = 0.875 × 0.857 × 0.95 = 71%. The shift 'ran' for seven hours and the machine looked busy, but it delivered 71% of what it was capable of.
There is a shortcut that gives the same answer: good parts × ideal cycle time ÷ planned production time. For the example, 684 × 0.5 minutes ÷ 480 minutes = 71%. The shortcut is useful for a quick check; the three-factor version tells you where the 29% went.
What is a good OEE score?
The figures most often quoted in the industry are 85% as a world-class target, around 60% as a typical discrete-manufacturing average, and 40% or lower for plants that have never measured it before (Katana, OEE in manufacturing). The 85% figure comes from the common rule of thumb of 90% availability, 95% performance and 99% quality, which multiply to roughly 85%.
Treat those numbers with care. Whether 65% is good depends on the process: a high-mix job shop with hourly changeovers will never match a dedicated bottling line, and comparing the two is meaningless. The honest benchmark is your own line last quarter.
Two things are more useful than the headline score. First, which of the three factors is lowest, because that is where the next improvement is. Second, whether the score is calculated the same way every shift, because an OEE that quietly changes its definition when a new supervisor arrives is worthless as a trend.
If your plant has never measured OEE, expect the first honest number to be lower than anyone's guess. That is normal, and it is the reason to measure.
What are the six big losses?
Each OEE factor absorbs two classic categories of loss. Naming them matters because the fix for each is different.
- OEE factor : Availability
Loss : Equipment failure
What it looks like on the floor : Unplanned breakdowns, waiting for maintenance
Typical fix : Preventive and predictive maintenance, spares on hand
- OEE factor : Availability
Loss : Setup and adjustments
What it looks like on the floor : Changeovers, tooling swaps, first-off approval
Typical fix : SMED (quick changeover), standard setup sheets
- OEE factor : Performance
Loss : Idling and minor stops
What it looks like on the floor : Jams, misfeeds, sensor trips cleared in under a minute
Typical fix : Root-cause the top three stops; they are rarely random
- OEE factor : Performance
Loss : Reduced speed
What it looks like on the floor : Running below rated cycle time 'to be safe'
Typical fix : Verify the true ideal cycle time, then fix what forces the slowdown
- OEE factor : Quality
Loss : Process defects
What it looks like on the floor : Scrap and rework during steady running
Typical fix : Statistical process control, operator checks at the point of cause
- OEE factor : Quality
Loss : Reduced yield
What it looks like on the floor : Scrap produced during start-up and after changeovers
Typical fix : Warm-up standards, first-off procedures
Most plants find that one or two of these dominate. Minor stops are the usual surprise: individually too short to log, collectively the largest loss on the line.
What are the common mistakes when measuring OEE?
- Using a soft ideal cycle time. If the rated speed is set to what the machine usually does rather than what it can do, performance reads close to 100% and the biggest loss disappears. Use the design speed or the best sustained rate ever recorded.
- Counting reworked parts as good. Rework hides in quality and reappears as cost. A part is good only if it passed first time.
- Moving planned downtime around to flatter the number. Breaks, meetings and planned maintenance are legitimately excluded, but the rules for what counts as planned must be written down and fixed. Otherwise OEE becomes negotiable.
- Chasing the plant-wide average. Averaging OEE across unrelated lines produces a number nobody can act on. Measure at the bottleneck first; improvement there is improvement for the whole plant.
- Using OEE to judge people. Operators who are scored on OEE will find ways to protect the score. Use it to find losses, not to rank shifts.
- Buying software before agreeing definitions. Automated data capture is valuable, but it automates whatever definitions you feed it. Settle the rules on paper for a month first.
Where to start
Pick your bottleneck machine, agree the three definitions in writing, and log one shift by hand on a clipboard. One honest shift of data will tell you more than a month of debate about which software to buy.
Advice Consultancy helps small and mid-sized manufacturers set up OEE measurement that people trust: agreeing the definitions, running the first manual baseline, and turning the biggest loss into a focused improvement project.
To talk through where to start on your line, contact us through the form on our contact page / book a call via the link on our contact page.